Scale, Standardize, or Normalize with Scikit-Learn
When to use MinMaxScaler, RobustScaler, StandardScaler, and Normalizer
Many machine learning algorithms work better when features are on a relatively similar scale and close to normally distributed. MinMaxScaler, RobustScaler, StandardScaler, and Normalizer are scikit-learn methods to preprocess data for machine learning. Which method you need, if any, depends on your model type and your feature values.
This guide will highlight the differences and similarities among these methods and help you learn when to reach for which tool.

As often as these methods appear in machine learning workflows, I found it difficult to find information about which of them to use when. Commentators often use the terms scale, standardize, and normalize interchangeably. However, their are some differences and the four scikit-learn functions we will examine do different things.
First, a few housekeeping notes:
- The Jupyter Notebook on which this article is based can be found here.
- In this article, we aren’t looking at log transformations or other transformations aimed at reducing the homoscedasticity of the errors.
- This guide is current as of scikit-learn v0.20.3.
What do These Terms Mean?
Scale generally means to change the range of the values. The shape of the distribution doesn’t change. Think about how a scale model of a building has the same proportions as the original, just smaller. That’s why we say it is drawn to scale. The range is often set at 0 to 1.
Standardize generally means changing the values so that the distribution standard deviation from the mean equals one. It outputs something very close to a normal distribution. Scaling is often implied.
Normalize can be used to mean either of the above things (and more!). I suggest you avoid the term normalize, because it has many definitions and is prone to creating confusion.
If you use any of these terms in your communication, I strongly suggest you define them.
Why Scale, Standardize, or Normalize?
Many machine learning algorithms perform better or converge faster when features are on a relatively similar scale and/or close to normally distributed. Examples of such algorithm families include:
- linear and logistic regression
- nearest neighbors
- neural networks
- support vector machines with radial bias kernel functions
- principal components analysis
- linear discriminant analysis
Scaling and standardizing can help features arrive in more digestible form for these algorithms.
The four scikit-learn preprocessing methods we are examining follow the API shown below. X_train and X_test are the usual numpy ndarrays or pandas DataFrames.
from sklearn import preprocessingmm_scaler = preprocessing.MinMaxScaler()
X_train_minmax = mm_scaler.fit_transform(X_train)mm_scaler.transform(X_test)
We’ll look at a number of distributions and apply each of the four scikit-learn methods to them.
Original Data
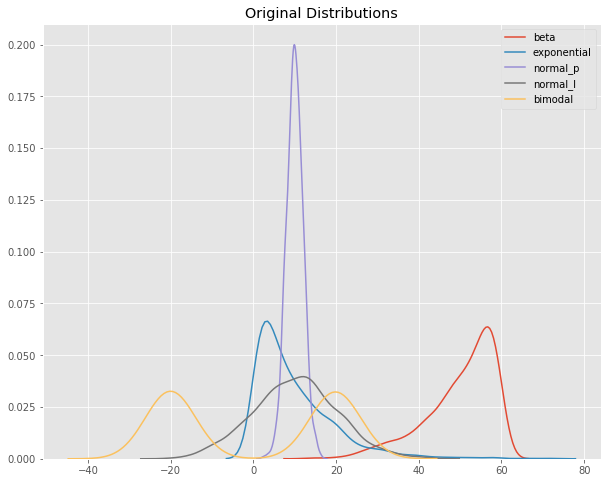
I created four distributions with different characteristics. The distributions are:
- beta — with negative skew
- exponential — with positive skew
- normal_p — normal, platykurtic
- normal_l — normal, leptokurtic
- bimodal — bimodal
The values all are of relatively similar scale, as can be seen on the X axis of the Kernel Density Estimate plot (kdeplot) below.

Then I added a fifth distribution with much larger values (normally distributed) — normal_big.
Now our kdeplot looks like this:


Squint hard at the monitor and you might notice the tiny green bar of big values to the right. Here are the descriptive statistics for our features.


Alright, let’s start scaling!
MinMaxScaler
For each value in a feature, MinMaxScaler subtracts the minimum value in the feature and then divides by the range. The range is the difference between the original maximum and original minimum.
MinMaxScaler preserves the shape of the original distribution. It doesn’t meaningfully change the information embedded in the original data.
Note that MinMaxScaler doesn’t reduce the importance of outliers.
The default range for the feature returned by MinMaxScaler is 0 to 1.
Here’s the kdeplot after MinMaxScaler has been applied.


Notice how the features are all on the same relative scale. The relative spaces between each feature’s values have been maintained.
MinMaxScaler is a good place to start unless you know you want your feature to have a normal distribution or want outliers to have reduced influence.


RobustScaler
RobustScaler transforms the feature vector by subtracting the median and then dividing by the interquartile range (75% value — 25% value).


Like MinMaxScaler, our feature with large values — normal-big — is now of similar scale to the other features. Note that RobustScaler does not scale the data into a predetermined interval like MinMaxScaler. It does not meet the strict definition of scale I introduced earlier.
Note that the range for each feature after RobustScaler is applied is larger than it was for MinMaxScaler.
Use RobustScaler if you want to reduce the effects of outliers, relative to MinMaxScaler.
Now let’s turn to StandardScaler.
StandardScaler
StandardScaler standardizes a feature by subtracting the mean and then scaling to unit variance. Unit variance means dividing all the values by the standard deviation. StandardScaler does not meet the strict definition of scale I introduced earlier.
StandardScaler results in a distribution with a standard deviation equal to 1. The variance is equal to 1 also, because variance = standard deviation squared. And 1 squared = 1.
StandardScaler makes the mean of the distribution 0. About 68% of the values will lie be between -1 and 1.

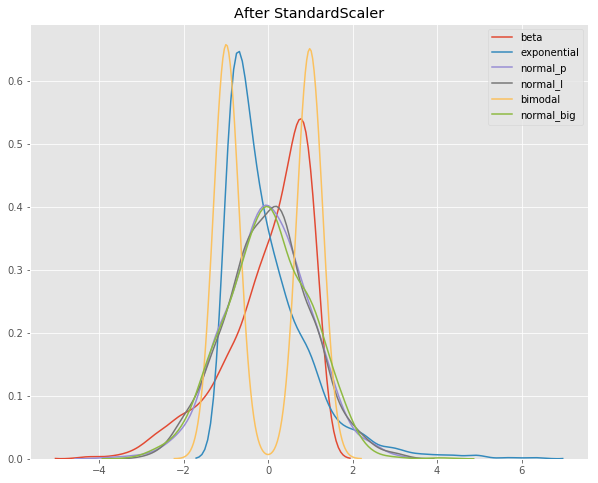
In the plot above, you can see that all four distributions have a mean close to zero and unit variance. The values are on a similar scale, but the range is larger than after MinMaxScaler.
Deep learning algorithms often call for zero mean and unit variance. Regression-type algorithms also benefit from normally distributed data with small sample sizes.
StandardScaler does distort the relative distances between the feature values, so it’s generally my second choice in this family of transformations.
Now let’s have a look at Normalizer.
Normalizer
Normalizer works on the rows, not the columns! I find that very unintuitive. It’s easy to miss this information in the docs.
By default, L2 normalization is applied to each observation so the that the values in a row have a unit norm. Unit norm with L2 means that if each element were squared and summed, the total would equal 1. Alternatively, L1 (aka taxicab or Manhattan) normalization can be applied instead of L2 normalization.


Normalizer does transform all the features to values between -1 and 1 (this text updated July 2019). In our example, normal_big ends up with all its values transformed to .9999999.
Have you found good use cases for Normalizer? If so, please let me know on Twitter @discdiver.
In most cases one of the other preprocessing tools above will be more helpful.
Again, scikit-learn’s Normalizer works on the rows, not the columns.
Comparison
Here are plots of the original distributions before and after MinMaxScaler, RobustScaler, and StandardScaler have been applied.


Note that after any of these three transformations the values are on a similar scale. Also notice that MinMaxScaler doesn’t distort the distances between the values in each feature.
Wrap
- Use MinMaxScaler as the default if you are transforming a feature. It’s non-distorting.
- You could use RobustScaler if you have outliers and want to reduce their influence. However, you might be better off removing the outliers, instead.
- Use StandardScaler if you need a relatively normal distribution.
- Use Normalizer sparingly — it normalizes sample rows, not feature columns. It can use l2 or l1 normalization.
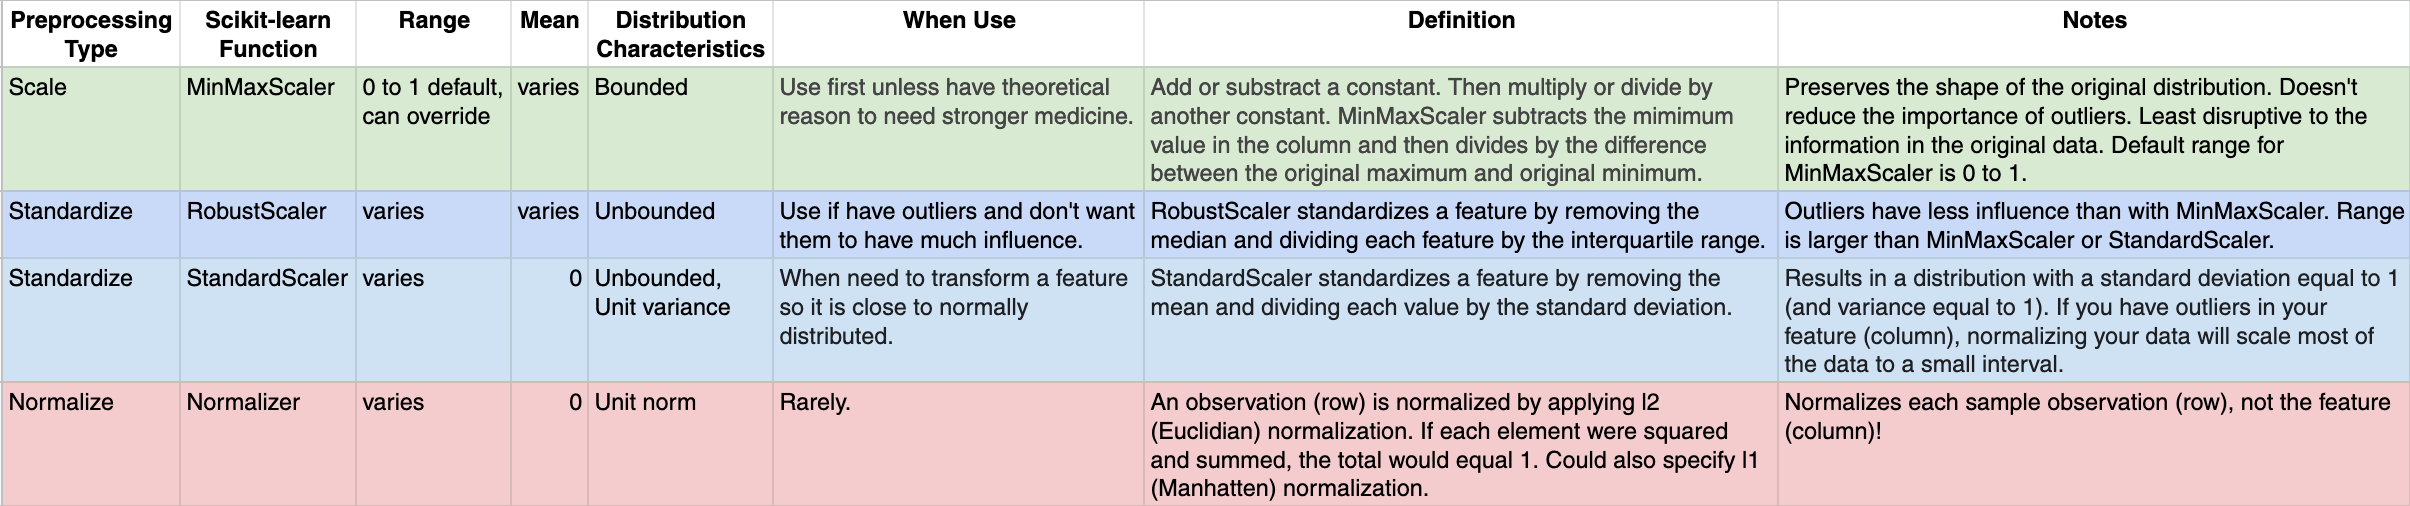
Here’s a cheat sheet I made in a Google Sheet to help you keep the options straight:

In this article you’ve seen how scikit-learn can help you scale, standardize, and normalize your data.
Resources to go deeper:
- Here’s a scikit-learn doc on preprocessing data.
- Here’s another doc about the effects of scikit-learn scalers on outliers.
- Here’s a nice guide to probability distributions by Sean Owen.
- Here’s another guide comparing these functions by Ben Alex Keen.
I hope you found this guide helpful. If you did, please share it on your favorite social media channel. 👏
I write about Python, Docker, SQL, pandas, and other data science topics. If any of those topics interest you, read more here and follow me on Medium. 😃
No comments:
Post a Comment